Learning Analytics Workflow is designed for those seeking an introductory understanding of learning analytics using basic R programming skills, particularly in the context of STEM education research.
It consists of consists of four modules. Each module of LAW includes:
Essential readings
Conceptual overview slidedeck
Code a-long slidedeck
Case study activity that correlates with the Learning Analytics workflow
Optional badge activity
Module 4 Objectives
Fundamentals of Data Visualization:
Learners will grasp the basic concepts and significance of data visualization in distilling complex educational data into comprehensible and actionable insights.
Variety of Visualization Techniques:
Participants will be able to identify and apply different types of visualizations, such as charts, graphs, and heatmaps, to represent educational data effectively.
Practical Application and Best Practices:
Learners will gain insights into real-world applications of data visualization in education and learn best practices to enhance the clarity and impact of their visual data presentations.
Who are some of the stakeholders that you communicate your findings?
What experiences have you had with communicating the results of data analysis and how did you communicate these findings?
What are some things you are normally asked to communicate? What types of products must you produce?
Communicating Effectively with Stakeholders
Data Storytelling
“Data storytelling is a method of communicating information that pairs data with visualization and narrative tailored to a particular audience” (Anderson, 2020).
Education stakeholders:
Administrators
Teachers
Other practitioners
Students & their families
More Points
Tell a story (characters, setting, conflict, resolution)
Use “signposts”
Explain the data and why it matters
Add graphs and visualizations (but not too much!) to enhance understanding
Code and its output appear together in the file/report
Contains 3 types of content:
YAML (optional)
Chunks of R code
Text with simple formatting text
Use knit to produce a complete report
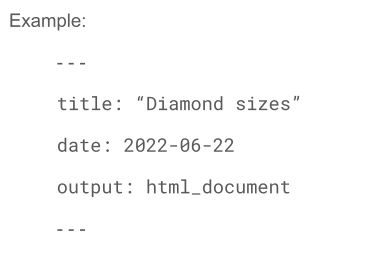
An optional header that gives instructions for “whole document” settings
This example demonstrates controls for title, date, and output format
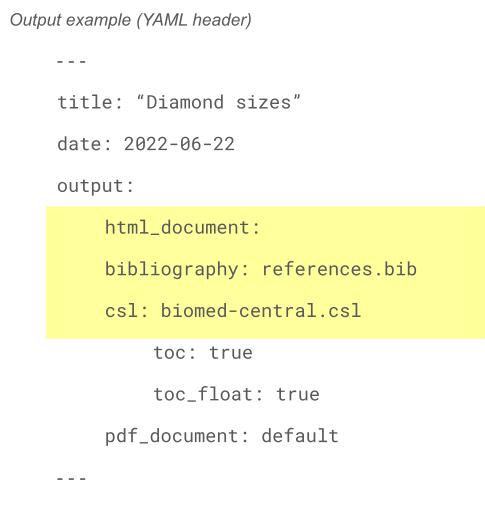
Default table formatting in R Markdown is same as what appears in console. Add formatting with knitr::kable function. For additional customization, see help within the IDE with ?knitr::kable.
Additional packages allow for further customization:
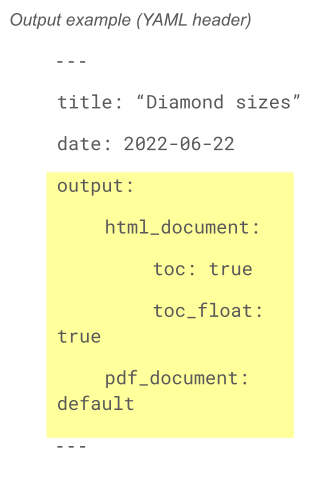
There are two ways to set the output of a document:
Permanently, by modifying the YAML header
Transiently, by calling rmarkdown::render()
Useful if you want to produce multiple types of output
When you knit, R will automatically put output indicated in the YAML header, but you can choose something different from the dropdown menu beside the knit button