What is Supervised Machine Learning?
Conceptual Overview
Agenda
- Purpose and Agenda
- Discussion 1
- Key Concept: LASER framework
- Key Concept: Machine Learning
- Discussion 2
- Modules Overview
- What’s Next
Purpose and Agenda
Purpose (All Modules!)
Machine learning is increasingly prevalent in our lives—and in educational contexts. Its role in educational research and practice is growing, albeit with some challenges and even controversy. These modules are designed to familiarize you with supervised machine learning and its applications in STEM education research. Throughout the module, we’ll explore four key questions that correspond to the focus of each of the four modules. By the end, you will have a deep understanding of the key characteristics of supervised machine learning and how to implement supervised machine learning workflows in R and Python.
Discussion 1
Discussion Questions
Getting Started
- Explain why are you interested in machine learning.
Digging Deeper
- Is there a specific use case of machine learning in which you are especially interested? Consider the data and purpose.
Key Concept: LASER frame
Overview
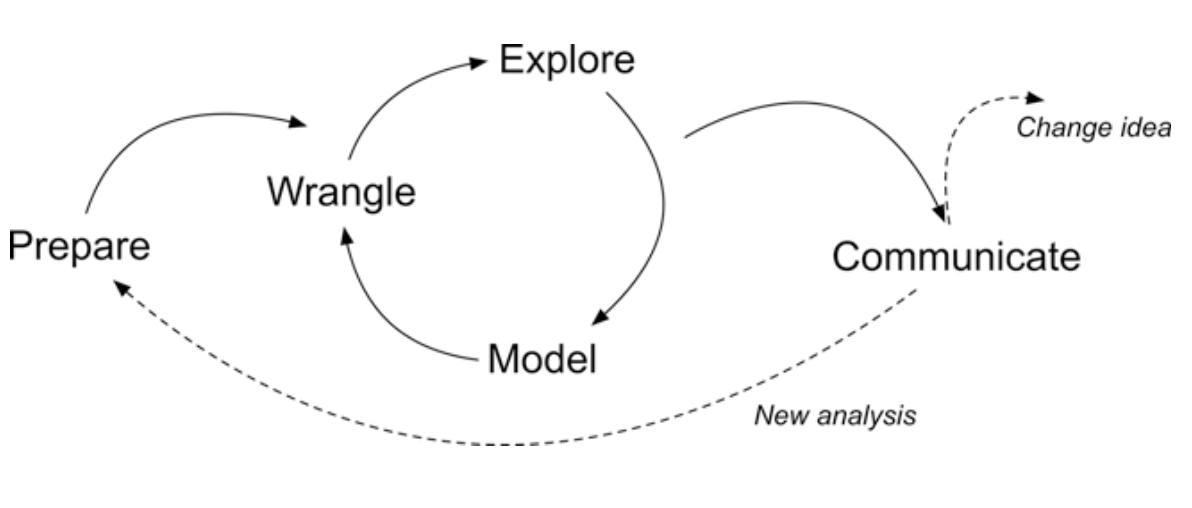
The Five Steps
Prepare: Prior to analysis, we’ll look at the context from which our data came, formulate a basic research question, and get introduced the {tidymodels} packages for machine learning.
Wrangle: Wrangling data entails the work of cleaning, transforming, and merging data. In Part 2 we focus on importing CSV files and modifying some of our variables.
Explore: We take a quick look at our variables of interest and do some basic “feature engineering” by creating some new variables we think will be predictive of students at risk.
Model: We dive deeper into the five steps in our supervised machine learning process, focusing on the mechanics of making predictions.
Communicate: To wrap up our case study, we’ll create our first “data product” and share our analyses and findings by creating our first web page using R Markdown.
Key Concept: Machine Learning
Let’s get a “feel” for it machine learning
Google’s Teachable Machine!
https://teachablemachine.withgoogle.com/
What’s going on here?
Defining AI and ML
- Artificial Intelligence (AI) (i.e., GPT-4): Simulating human intelligence through the use of computers
- Machine learning (ML): A subset of AI focused on how computers acquire new information/knowledge
This definition leaves a lot of space for a range of approaches to ML.
Supervised ML (or SML)
- Requires coded data, or data with a known outcome
- Uses coded/outcome data to train an algorithm
- Uses that algorithm to predict the codes/outcomes for new data (data not used during the training)
- Can take the form of a classification (predicting a dichotomous or categorical outcome) or a regression (predicting a continuous outcome)
- Algorithms include:
- Linear regression (really!)
- Logistic regression
- Random forest
- Neural network
What kind of coded data?
Want to detect spam? Get samples of spam messages. Want to forecast stocks? Find the price history. Want to find out user preferences? Parse their activities on Facebook (no, Mark, stop collecting it, enough!) (from ML for Everyone)
In educational research:
How is this different from regression?
The aim is different, the algorithms and methods of estimation are not (or, are differences in degree, rather than in kind).
In a linear regression, our aim is to estimate parameters, such as \(\beta_0\) (intercept) and \(\beta_1\) (slope), and to make inferences about them that are not biased by our particular sample.
In a SML approach, we can use the same linear regression model, but with a goal other than making unbiased inferences about the \(\beta\) parameters:
In supervised ML, our goal is to minimize the difference between a known \(y\) and our predictions, \(\hat{y}\).
It’s the same!
We can use the same model for an inferential or an SML approach:
\(y\) = \(b_0\) + \(b_1\) + … + \(e\)
If we are interested in making inferences about a particular \(b\) (e.g., \(b_1\)), we can use theory and prior research to include particular predictors. This often favors transparent models where we understand how predictors relate to \(y\).
If we are interested in making the best possible predictions, we can potentially add more predictor variables than is common when using traditional (i.e., inferential) models
But different!
This predictive goal of SML means that we can do things differently:
- Multicollinearity is not necessarily an issue because we do not care as much to make inferences about individual parameters.
- Because interpreting specific parameters is less of a primary interest (though often still valuable!), we can use a great deal more predictors.
- We focus on how accurately a trained model can predict the values in test data.
- We can make our models very complex - leading to different levels of interpretability.
A Spectrum of Interpretability
- Transparent Box: Models where the relationship between inputs and outputs is clear.
- Example: Linear Regression (coefficients have direct meaning).
- Often preferred for inference.
- Black Box: Models where the internal logic is complex and opaque.
- Example: Deep Neural Networks.
- Often used when predictive accuracy is the absolute priority.
- Gray Box: Models offering some insight, but less direct than transparent ones.
- Example: Decision Trees, Random Forests (can see feature importance).
- Represents a middle ground.
Okay, really complex
The focus on prediction opens the door to highly complex models:
- Often “Black Box”:
- Neural/deep networks (e.g., GPT-4 with >1 Trillion parameters)
- Often “Gray Box” (can vary):
- Decision trees (interpretable path, but complex forests)
- Extensions: Bagging (Bootstrap Aggregating), Random Forests
- Boosting methods (combining weak learners)
- Different Forms:
- k-nearest neighbors (instance-based, less of a “model” in the traditional sense)
Choose Your Approach Wisely
There’s no single “best” way; the right tools depend on your goals:
What is your ultimate aim?
- Understanding specific relationships (inference -> lean transparent)?
- Making the most accurate predictions possible (prediction -> maybe black box is okay)?
- A balance of both (prediction + some explanation -> gray box)?
Don’t look for a magic answer! No model perfectly reflects reality. Resist the urge to let the model “tell you the answer” without critical thought.
Understand your tools: Even if prediction is the goal, knowing how your chosen model works (its assumptions, strengths, weaknesses) helps you:
Unsupervised ML
- Does not require coded data; one way to think about unsupervised ML is that its purpose is to discover codes/labels
- Can be used in an exploratory mode (see Nelson, 2020)
- Warning: The results of unsupervised ML cannot directly be used to provide codes/outcomes for supervised ML techniques
- Algorithms include:
- Cluster analysis and Latent Profile Analysis
- Principle Components Analysis (really!)
Inferential statistics
- Principally concerned about making inferences about parameters (e.g., \(B\) coefficients)
- Also involved with building a model that explains variation in the outcome
- Examples:
- Linear regression
- Multi-level models
- Structural equation models
Reinforcement Learning
What It Is:
A framework where an agent learns to make decisions by interacting with an environment.Core Components:
- Agent: The decision-maker.
- Environment: Where the agent operates.
- Actions & Rewards: Choices made by the agent and feedback (reward or penalty) from the environment.
- Agent: The decision-maker.
Key Idea:
Learning through trial and error to maximize long-term rewards.
Which technique should I choose?
Do you have coded data or data with a known outcome – let’s say about K-12 students – and, do you want to:
- Predict how other students with similar data (but without a known outcome) perform?
- Scale coding that you have done for a sample of data to a larger sample?
- Provide timely or instantaneous feedback, like in many learning analytics systems?
Supervised methods may be your best bet
Which technique should I choose?
Do you not yet have codes/outcomes – and do you want to?
- Achieve a starting point for qualitative coding, perhaps in a “computational grounded theory” mode?
- Discover groups or patterns in your data that may be of interest?
- Reduce the number of variables in your dataset to a smaller, but perhaps nearly as explanatory/predictive - set of variables?
Unsupervised methods may be helpful
Which technique should I choose?
Do you want to say something about one or several variables’ relations with an outcome?
- See how one or more variables relates to an outcome
- Understand whether a key variable is has a statistically significantly coefficient in terms of its relation with an outcome of interest
Inferential statistics may be best
In short
- If you’re interested in explaining relations, choose inferential statistics
- If you’re interested in making predictions, choose SML
- If you’re interested in exploring patterns in data, choose unsupervised ML
Some models blend between inferential and SML – we’ll talk about these as we proceed!
How do I select a model?
One general principle is to start with the simplest useful model and to build toward more complex models as helpful.
This principle applies in multiple ways:
- To choose an algorithm, start with simpler models that you can efficiently use and understand
- To carry out feature engineering, understand your predictors well by starting with a subset
- To tune an algorithm, start with a relatively simple set of tuning parameters
Discussion 2
- Think back to the use case (outcome) you mentioned earlier. How does (or could) SML be an appropriate technique to use?
- Why is it important to predict the outcome?
Modules Overview
Overview
SML Module 1: Foundations
How is prediction different from explanation? This module provides a gentle introduction to supervised machine learning by drawing out similarities to and differences from a regression modeling approach. The case study will involve modeling the graduation rate across 1,000s of higher education institutions in the United States using data from the Integrated Postsecondary Education Data System (IPEDS).
SML Module 2: Workflows With Training and Testing Data
Building on the foundations from Module 1, this session delves deeper into the workflows we will use when we are using a SML approach. Particularly, we’ll explore the roles of training and testing data and when to use them in a SML workflow. We’ll predict students’ withdrawal from a course again using the Integrated Postsecondary Education Data System (IPEDS) data.
SML Module 3: Interpreting SML Metrics
How is the interpretation of SML models different from more familiar models? In this module, we’ll explore and work to understand the confusion matrix that can and the various metrics (e.g., precision, recall, PPV, NPV, F-score, and AUC) that are used to interpret how good at making dichotomous predictions SML models are. We’ll again use the OULAD, augmenting the variables we used in Module 1, and we’ll introduce a more complex model—the random forest model—as an alternative to the regression models used in previous modules
SML Module 4: Improving Predictions Through Feature Engineering
How can we improve our predictions? This module introduces the concept of feature engineering to enhance model performance. We’ll explore techniques for creating new variables and refining existing ones to improve prediction accuracy. We also explore cross-validation to revise and refine our model without biasing its predictions. We’ll work with the finest-grained OULAD data—interaction data—to demonstrate key feature engineering steps.
What’s Next
Other parts of this module
- Uses built-in data (on Pokemon!) to demonstrate the SML workflow
- Compares the use of the same logistic regression model in a regression and SML “mode”
- Introduces the modeling cycle and process
Please see sml-1-readings.qmd
Brooks, C., & Thompson, C. (2017). Predictive modelling in teaching and learning. Handbook of Learning Analytics, 61-68.
Jaquette, O., & Parra, E. E. (2013). Using IPEDS for panel analyses: Core concepts, data challenges, and empirical applications. In Higher Education: Handbook of Theory and Research: Volume 29 (pp. 467-533). Dordrecht: Springer Netherlands.
Zong, C., & Davis, A. (2022). Modeling university retention and graduation rates using IPEDS. Journal of College Student Retention: Research, Theory & Practice*. https://journals.sagepub.com/doi/full/10.1177/15210251221074379
Please see sml-1-case-study.qmd
- Building a prediction model for graduate rates using data from National Center for Education Statistics data — IPEDS< specifically
- We’ll use not only the same data but also the same model in two modes - inferential regression modeling and predictive SML, seeing how the key is in how we use the model, not the model type
- Work with peers to complete this, reading the text, following links to resources (and the reading), and then completing the required 👉 Your Turn ⤵ tasks
- A key is available, but we strongly encourage you to use it only at the end to check your work, or if you are completely stuck and have tried our recommended troubleshooting steps: https://docs.google.com/document/d/14Jc-KG3m5k1BvyKWqw7KmDD21IugU5nV5edfJkZyspY/edit
Please see sml-1-badge.qmd
- Involves applying what you have done through this point in the module to a) extending our model and b) reflecting and planning, after which you will knit and submit your work by publishing to Posit Cloud.
Troubleshooting
- Please view this Google doc
- Change default settings: Tools -> Global Settings -> Workspace -> DO NOT restore workspace
- Change default settings: Tools -> Global Settings -> Workspace -> Save workspace to .RData NEVER
- Session -> Restart R and Clear Output is a good place to start
fin
General troubleshooting tips for R and RStudio
