Network Modeling & Applications
SNA Module 4: A Conceptual Overview
A Quick Refresher
Network Visualization

Network Measurement
degree and betweenness Centrality
Reciprocity in directed networks
complete network, group, or neighborhood Density
Inference in Networks
Evolution, Permutations, & Applications
Evolution
Aim of Inference
Examine “relationships”
Test hypotheses
Analyze change
Obstacles to Overcome
Violation of assumptions
Conventional formulas
Network dynamism
Permutations
Matrices are rearranged over and over (even thousands of times!)
Permutations are then compared to your observed data
If network properties of interest occur often, likely due to chance.

Applications
Tie A -> Tie B. Is there a relationship between the frequency of collaboration between school leaders and their discussion of confidential issues?
Tie A or B ->Tie C. Do school leaders prefer to collaborate with those with whom they have collaborated in the past?
Attributes ->Ties. Does gender or some other individual attribute predicts confidential exchanges between school leaders, or does some previous relation have a stronger effect?
Ties -> Attributes. Does collaboration between leaders explain one’s level of trust in colleagues?
Groups -> Attributes. Can we distinguish among different groups of school leaders based on how frequently they collaborate, and if so, are these groupings related to the level at which they work (school versus district)?
Discussion
Consider the following questions about a network you may be interested in studying:
What is the boundary of this network?
What relations within this network might be of interest to your research?
What attributes about actors in this network might you want to capture?
How might you collect data about these actors and their relations?
Models in Networks
QAP, P-Star, & Regression
QAP (Tie A-> Tie B)
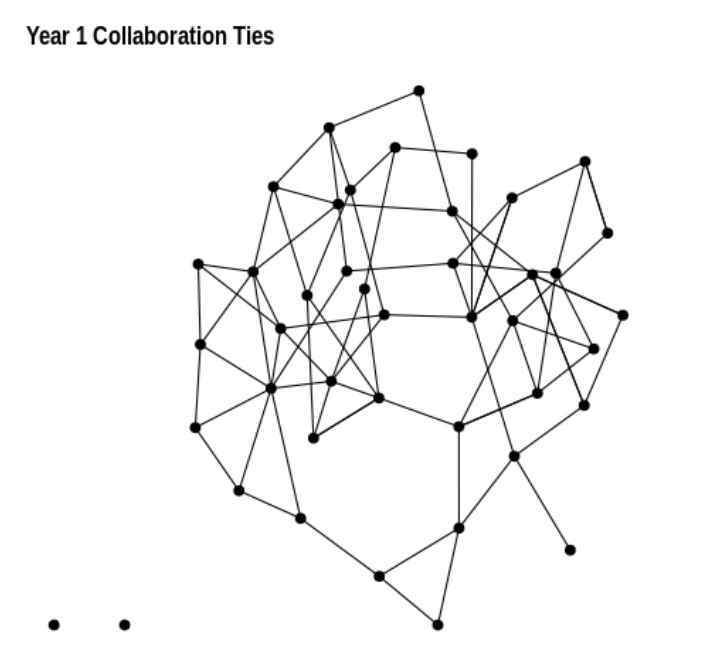
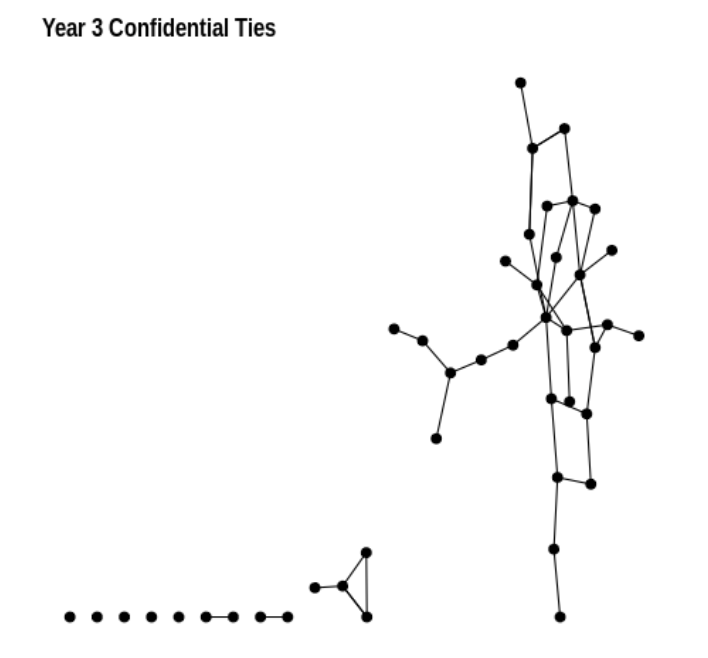
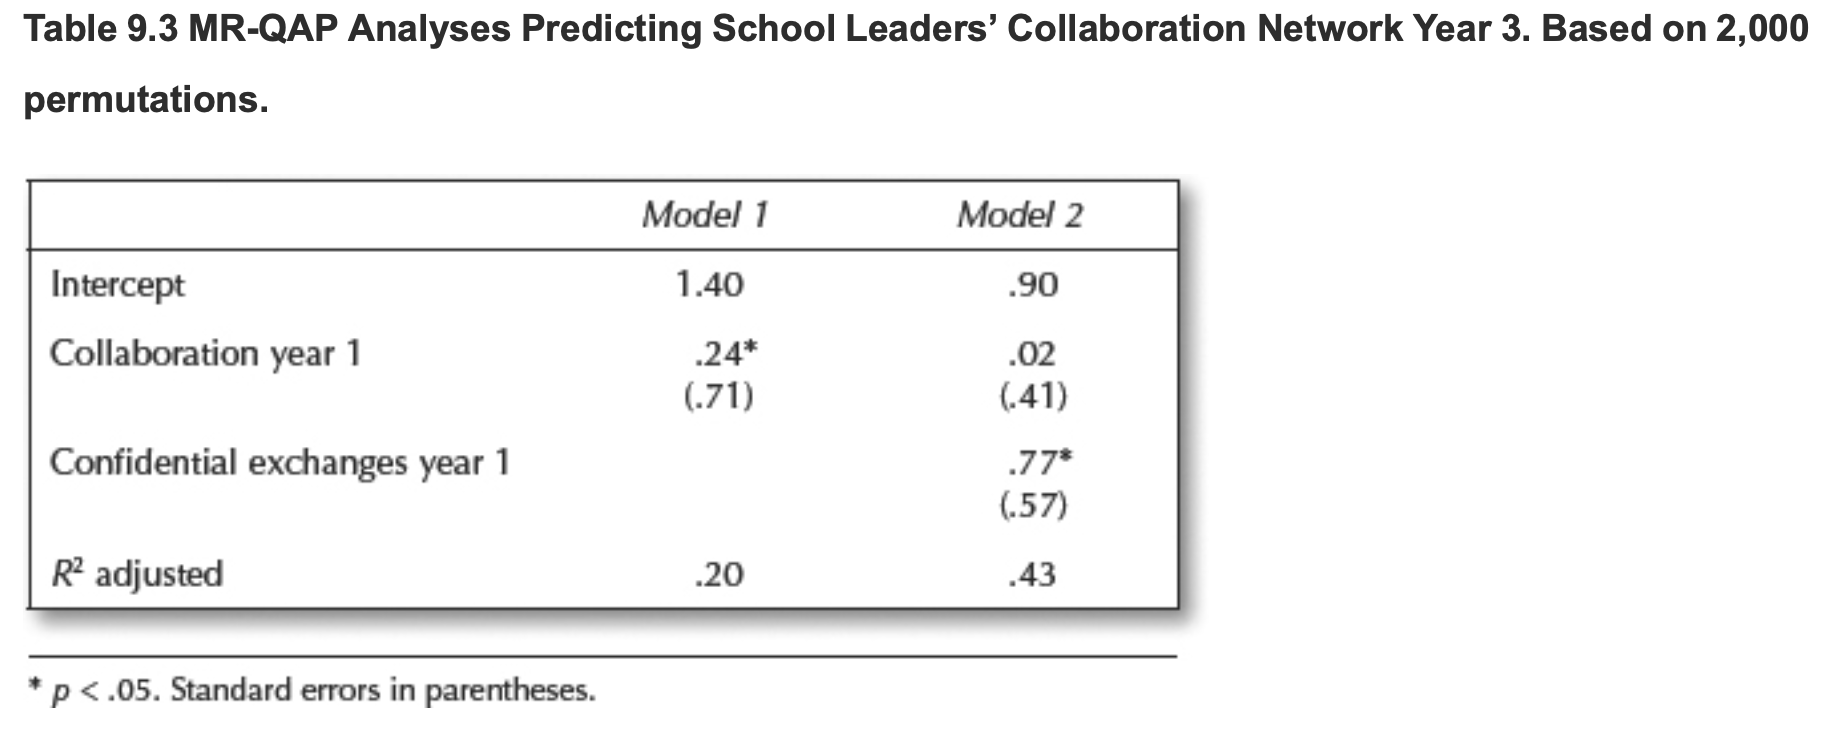
MR-QAP (Tie A or B ->Tie C)
Do school leaders prefer to collaborate with those with whom they have collaborated in the past or with those that they have discussed confidential issues?
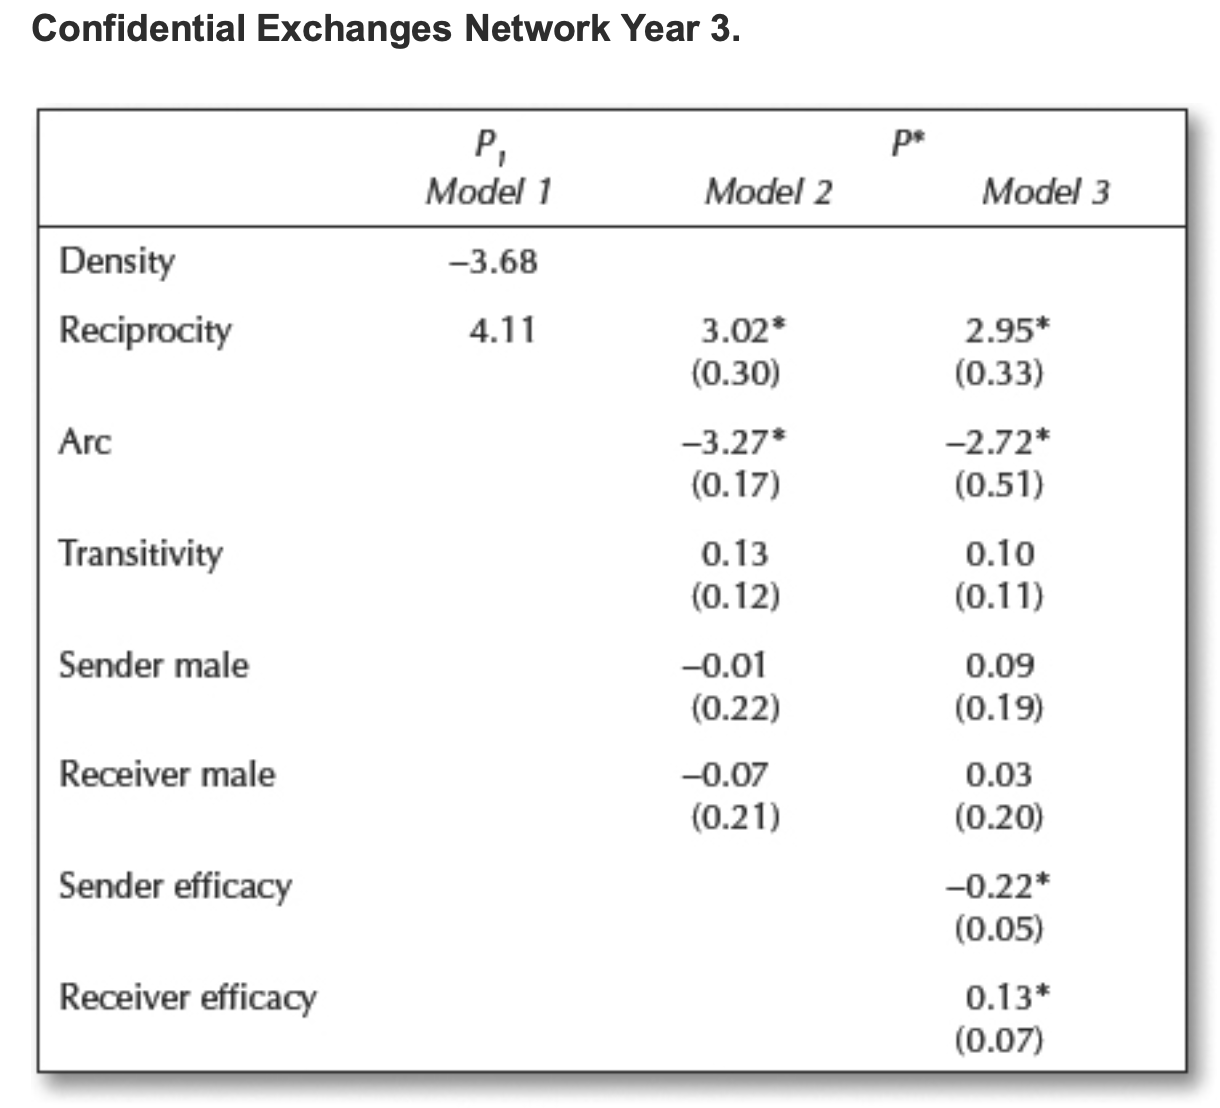
P1 & P-Star (Attributes -> Ties)
Does gender or some other individual attribute predicts confidential exchanges between school leaders, or does some previous relation have a stronger effect?
Regression (Ties -> Attributes)
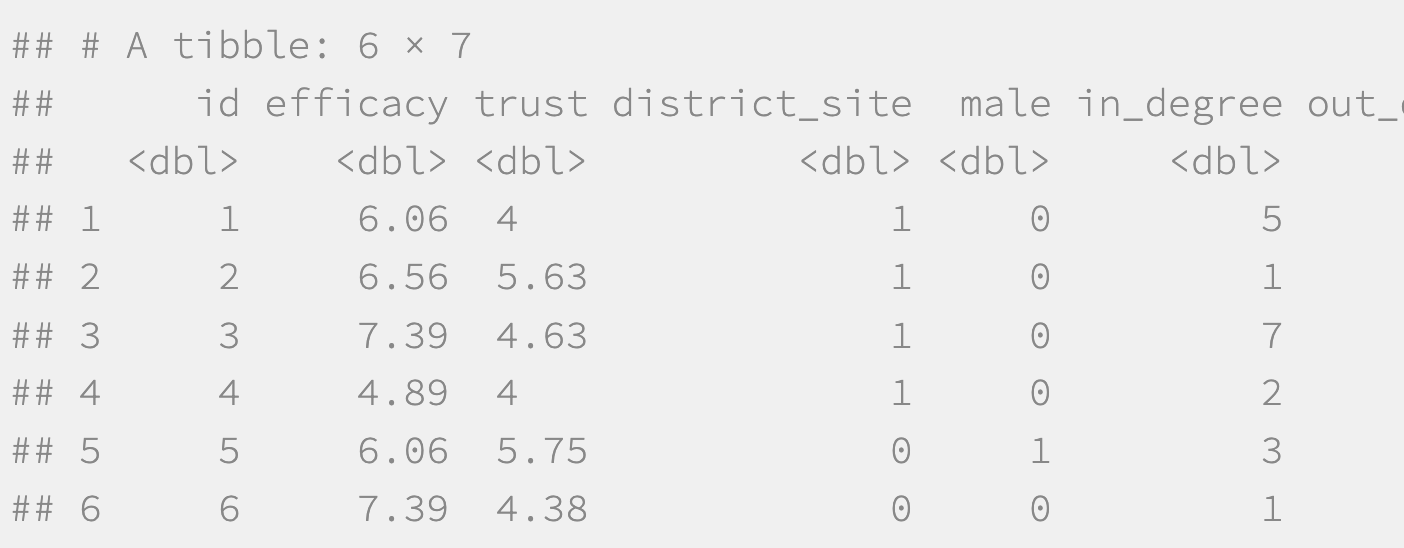
Does collaboration between leaders explain one’s level of trust in colleagues?
Discussion
Think about potential research questions we raised in the previous slide. What model might be appropriate for answering that question?
Hint: think about the what relationship is being tested:
ties-ties: QAP/MR-QAP
attributes-ties: P1 & P-Star
network properties-attributes: t-tests, anova, regression
Essential Readings
The following chapters in Carolan (2014) cover the topics introduced in this conceptual overview in much greater depth:
In preparation for the Module 4 Code-Along and Case Study, take a look at the study by Daly and Finnigan (2011).
Acknowledgements

This work was supported by the National Science Foundation grants DRL-2025090 and DRL-2321128 (ECR:BCSER). Any opinions, findings, and conclusions expressed in this material are those of the authors and do not necessarily reflect the views of the National Science Foundation.
