Intro to ERGMs
SNA Module 4: Code-Along
Overview
Prepare: A quick look at the study by Daly and Finnigan from whence our data was derived.
Wrangle: Learn how to convert matrices into more workable formats like a familiar edge-list.
Explore: View some basic network stats and make a quick sociogram.
Model: Learn to fit and interpret a very basic ERGM.
Communicate: Reflect on what we learned.
Prepare
Guiding Research & the ERGM Package
Guiding Study
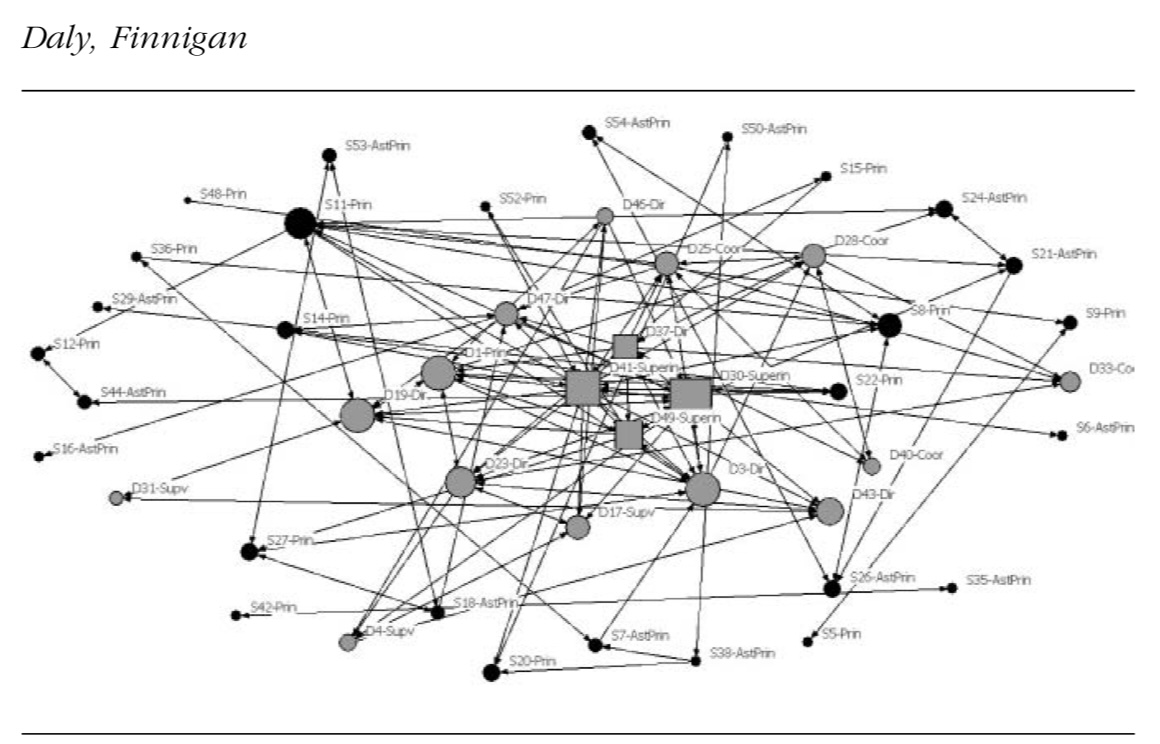
This longitudinal case study examines reform-related knowledge, advice, and innovation network structures among administrators in a district under sanction for under-performance and engaging in district-wide reform efforts.

This study involves quantifying and visualizing the ties and overall structure of informal networks to answer the following research questions:
In what ways have reform-related social networks between district and site leaders evolved over a 2-year period?
How do district and school leaders perceive the evolution of the social networks and its effect on the exchange of reform-related resources within the district?
To answer RQ1, Daly and Finnigan administered online survey consisting of network relations and demographic questions asking participants to:
select the administrators in the La Estasis network that they interact with for the purpose of advice seeking, collaboration, knowledge exchanges,
assess their relationships on a 5-point interaction scale ranging from 1 (no interaction) to 5 (1 to 2 times a week).
QAP
weak correlation between knowledge and innovation and advice and innovation
leaders with knowledge ties also likely to have advice relations
P-Star (SIENA)
Leaders with more experience more likely to be selected for reform-related advice
over time, leaders tended to create ties with those frequently identified as resources for innovative practices
Overall, the findings from SNA and qualitative interviews indicate that over time:
Networks increased the number of superficial interactions.
More frequent exchanges, however, remained unchanged.
The result was a centralized network structure.
Guiding Question
Does gender or some other individual attribute predict confidential exchanges between school leaders?
ERGMs are the primary building blocks of statistically testing network structural effects.
Uses simulation to determine the probability of network feature (e.g., reciprocity, clique, homophily)
Evolved to allow actor attributes for covariates
The {ergm} package is used to fit exponential-family random graph models (ERGMs) in R
Wrangle
Import Data & Tidy Graph
Import Data
Let’s import two Excel files from the Social Network Analysis and Education companion site. year_1_collaboration.xlsx
Think about the questions below and be prepared to share your response:
What do you think the values for each tie represent?
What do you think the “trust” and “efficacy” variables represent?
What else do you notice about this data?
What else do you wonder about this data?
Hint: Take a look at the SNA in Ed companion site
Edge values indicate the frequency of interactions leaders have with nominated individuals on a four-point frequency scale ranging from 1 (the least frequent) to 4 (1–2 times a week).
efficacymeasures a belief in their ability to have an effect derived from a scale that includes 18 items rated on a 9-point Likert scale ranging from 1 (None at all) to 9 (A great deal).trustmeasures perceptions of the level of trust their school and district is a composite score based on scale contains eight items rated on a 7-point Likert scale ranging from 1 (Strongly disagree) to 7 (Strongly agree).
Convert to “Network”
The {ergm} package requires an object of the class “network” — the format that {statnet} uses to store and work with network data.
The as.network() function does just that. Run the following code in your console to pull up the help page for the as.network() function and let’s take a look:
Run the following code in your R script to combine our edge and node lists into a single “network” object:
Explore
Network Stats & A Quick Sociogram
View Network
First, let’s take a quick look at our network by printing

Model
Model Specification & ERGM Parameters
Base ERGM
The syntax for specifying a model in the ergm package follows R’s formula convention: my_network ~ ergm_term_1 + ergm_term_2 + ergm_term_3 and so forth.
In the Help tab, search for “ergm-terms” and select the ergm::ergm-terms help page to take a quick peek at the plethora of parameters you can include in your model.
Let’s start with with a simple model that contains the following ergm-terms
edgesa required term that represents the total number of edges in the networkmutualexamines the tendency for ties to be reciprocated, i.e. “mutuality”.
Call:
ergm(formula = leader_network ~ edges + mutual)

Monte Carlo Maximum Likelihood Results:

       Estimate Std. Error MCMC % z value Pr(>|z|)
edges   -3.1094     0.1247      0  -24.94   <1e-04 ***
mutual   3.0984     0.2825      0   10.97   <1e-04 ***
---
Signif. codes:  0 '***' 0.001 '**' 0.01 '*' 0.05 '.' 0.1 ' ' 1

     Null Deviance: 2503.6  on 1806  degrees of freedom
 Residual Deviance:  892.4  on 1804  degrees of freedom

AIC: 896.4  BIC: 907.4  (Smaller is better. MC Std. Err. = 0.9802)
ERGM 2
Let’s now test for homophily – or the “birds of a feather” phenomenon – in our network. The ergm() function now includes a nodematch() term to answer the following question:
Are school leaders more likely to confide in colleagues of their own gender or who work at the same site level (e.g., school vs. central office)?
Call:
ergm(formula = leader_network ~ edges + mutual + nodematch("male") +
    nodematch("district_site"))

Monte Carlo Maximum Likelihood Results:

                        Estimate Std. Error MCMC % z value Pr(>|z|)
edges                    -3.6211     0.1797      0 -20.152   <1e-04 ***
mutual                    2.9306     0.2968      0   9.874   <1e-04 ***
nodematch.male           -0.1223     0.1492      0  -0.820    0.412
nodematch.district_site   0.9765     0.1811      0   5.393   <1e-04 ***
---
Signif. codes:  0 '***' 0.001 '**' 0.01 '*' 0.05 '.' 0.1 ' ' 1

     Null Deviance: 2503.6  on 1806  degrees of freedom
 Residual Deviance:  856.6  on 1802  degrees of freedom

AIC: 864.6  BIC: 886.6  (Smaller is better. MC Std. Err. = 0.9926)
ERGM 3
Are school leaders with higher levels of trust more likely to have confidential exchanges?
Call:
ergm(formula = leader_network ~ edges + mutual + nodematch("male") +
    nodematch("district_site") + nodecov("trust"))

Monte Carlo Maximum Likelihood Results:

                        Estimate Std. Error MCMC % z value Pr(>|z|)
edges                   -4.55696    0.74818      0  -6.091   <1e-04 ***
mutual                   2.92834    0.29576      0   9.901   <1e-04 ***
nodematch.male          -0.11155    0.14675      0  -0.760    0.447
nodematch.district_site  0.93434    0.17363      0   5.381   <1e-04 ***
nodecov.trust            0.09920    0.07539      0   1.316    0.188
---
Signif. codes:  0 '***' 0.001 '**' 0.01 '*' 0.05 '.' 0.1 ' ' 1

     Null Deviance: 2503.6  on 1806  degrees of freedom
 Residual Deviance:  854.6  on 1801  degrees of freedom

AIC: 864.6  BIC: 892.1  (Smaller is better. MC Std. Err. = 0.8594)
What’s Next?
SNA Case Study: Birds of Feather Lead Together
Guiding Study: Ebb and Flow of Social Network Ties Between District Leaders (Daly and Finnigan 2011)
Acknowledgements

This work was supported by the National Science Foundation grants DRL-2025090 and DRL-2321128 (ECR:BCSER). Any opinions, findings, and conclusions expressed in this material are those of the authors and do not necessarily reflect the views of the National Science Foundation.
