Density, Reciprocity, & Centrality
SNA Module 2: Code-Along
Overview
Prepare: Introduce the guiding study and {igraph} package.
Wrangle: Revisit the {readr} and {tidygraph} packages to import and prepare edge and node lists.
Explore: Calculate a range of network-level measures to describe and compare collaboration networks over time.
Model: Introduce how modeling can was used to examine MOOC-Ed discussion networks.
Communicate: Briefly examine how these measure can be reported.
Prepare
Guiding Research & Network Packages
Guiding Study
This mixed-methods case study used both SNA and qualitative methods to better understand peer support in MOOC-Eds through an examination of the characteristics, mechanisms, and outcomes of peer networks.

This study involves quantifying and visualizing the ties and overall structure of informal networks to answer the following research questions:
What are the patterns of peer interaction and the structure of peer networks that emerge over the course of a MOOC-Ed?
To what extent do participant and network attributes (e.g., homophily, reciprocity, transitivity) account for the structure of these networks?
To what extent do these networks result in the co-construction of new knowledge?
MOOC-Ed registration form. All participants completed a registration form for each MOOC-Ed course. The registration form consists of self-reported demographic data, including information related to their professional role and work setting, years of experience in education, and personal learning goals.
MOOC-Ed discussion forums. All peer interaction, including peer discussion, feedback, and reactions (e.g., likes), take place within the forum area of MOOC-Eds, which are powered by Vanilla Forums.
Most ties between educators consisted of a single communication and a general tendency for an individual’s responses to be distributed evenly among peers.
Measures of network reciprocity were fairly similar across the two MOOC-Eds, despite the size and varied composition of educators in each network.
Reciprocators made up the largest proportion of educators in both courses
Significant effects were found for the relational mechanism of reciprocity, but not for a popularity effect.
Load Packages
Let’s start by creating a new R script and loading the following packages introduced in the previous module:
The {igraph} package and its collection of network analysis tools provide pain-free implementation of graph algorithms fast handling of large graphs, with millions of vertices and edges.
Both {tidygraph} and {ggraph} used in the previous lab depend heavily on the {igraph} package.
Wrangle
Intro to Network Data Structures
Import Data
Let’s import two .csv files from our data folder named dlt1-edges.csv and dlt1-nodes.csv using the read_csv() function from the {readr} package:
dlt1_ties <- read_csv("data/dlt1-edges.csv",
                      col_types = cols(Sender = col_character(),
                                       Receiver = col_character(),
                                       `Category Text` = col_skip(),
                                       `Comment ID` = col_character(),
                                       `Discussion ID` = col_character()
                                       )
                      ) |>
  clean_names()

dlt1_actors <- read_csv("data/dlt1-nodes.csv",
                   col_types = cols(UID = col_character(),
                                    Facilitator = col_character(),
                                    expert = col_character(),
                                    connect = col_character())) |>
  clean_names()
Using your R script or the console or another prefered means, take a look at the data file we just imported:
Think about the questions below and be prepared to share your response:
What type of data structure is used to store this network data?
What do you think the rows and columns represent?
What do the values in each cell represent?
Create Network Object
Before we can begin analyzing our network data in R, we need to convert to a network class R object. Run the following code in your R script:
Think about the questions below:
What size of the DLT 1 MOOC-ED network?
What else do you notice about this network?
What questions, if any, do have about this network?
Explore
Network Density, Centrality, & Reciprocity
Network Density
In its simplest form, network density is the ratio of existing ties in a network to all possible ties that could potentially exist, regardless of whether they do.
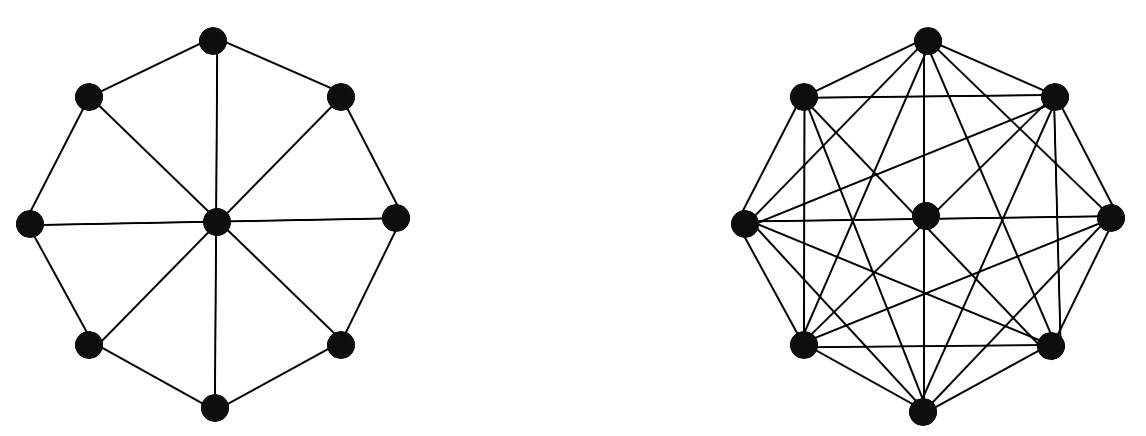
In education, dense networks have been associated with:
community health
flow of resources within a network
student achievement
For better or worse, dense networks reinforce prevailing norms and behaviors and insulate one from outside influences (Carolan 2014).
The {igraph} package has a simple edge_density() function for calculating network density.
Let’s apply to our dlt1_network:
How would you interpret this measure?
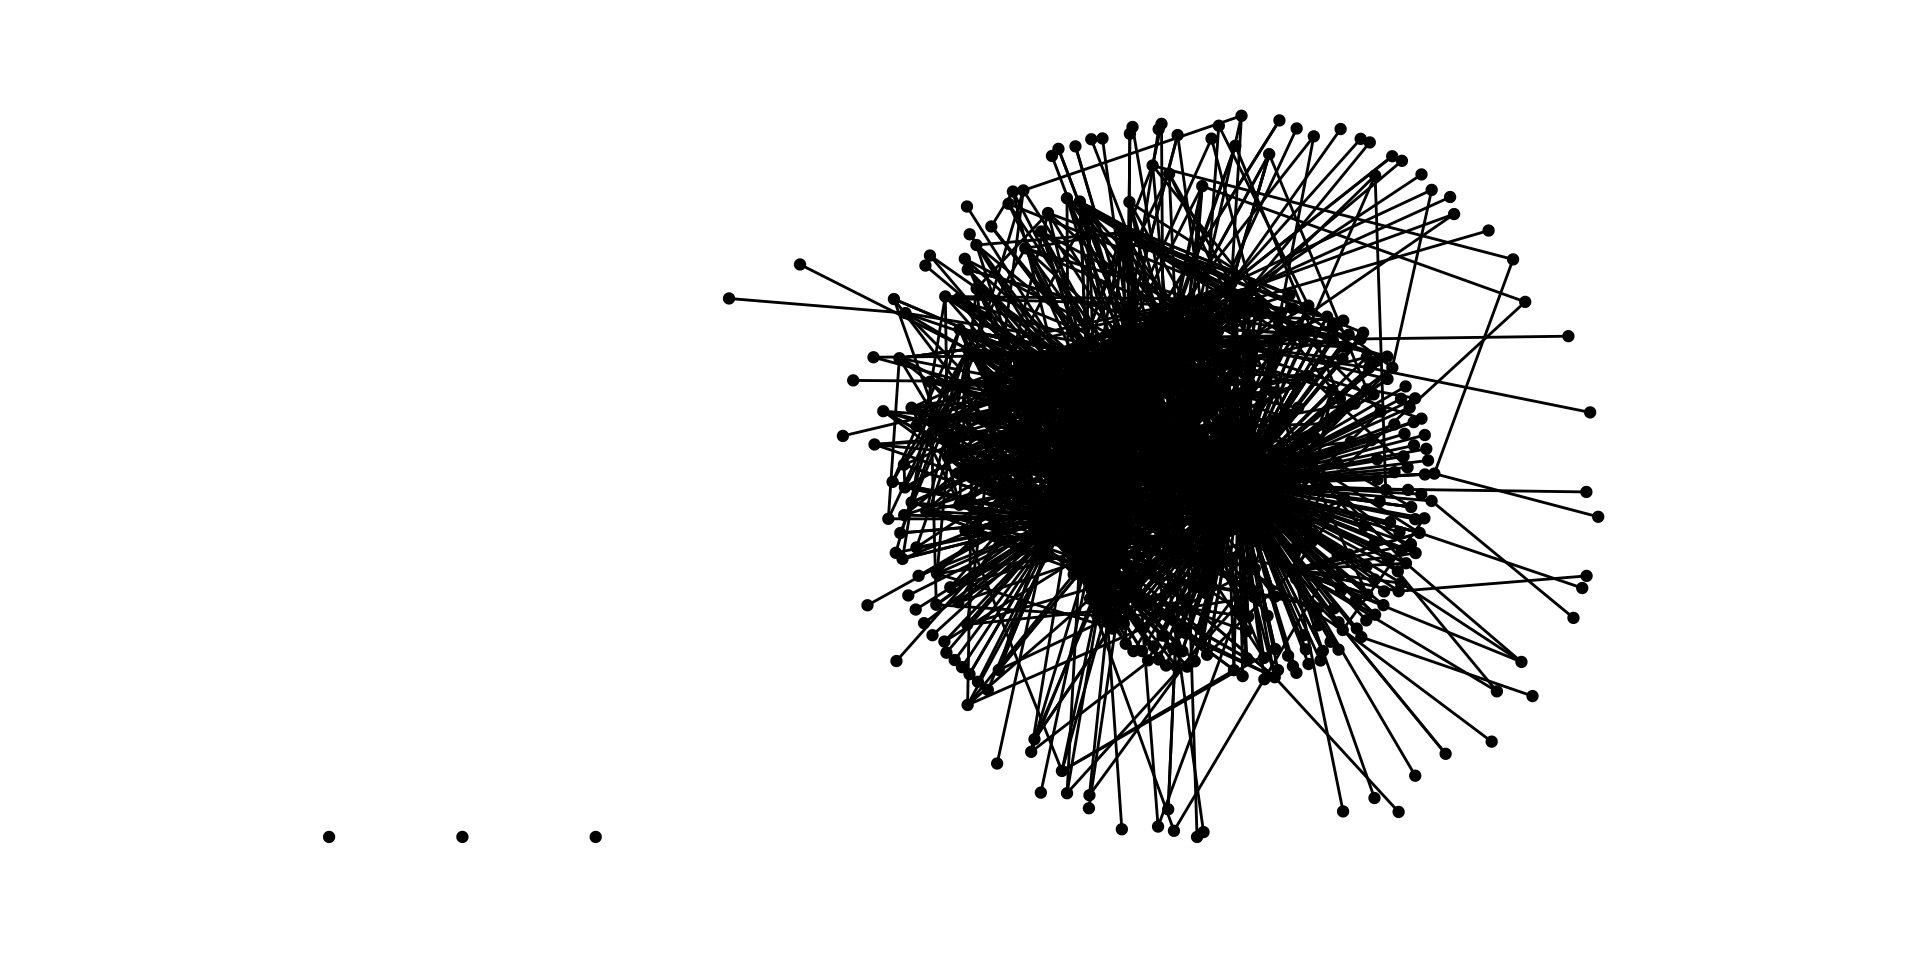
We know there 2529 edges in the DLT 1 network (pictured right), but how many possible edges could there be?
Hint: The number of all possible edges in a directed network is V(V-1) where V is the # of vertices.
Reciprocity
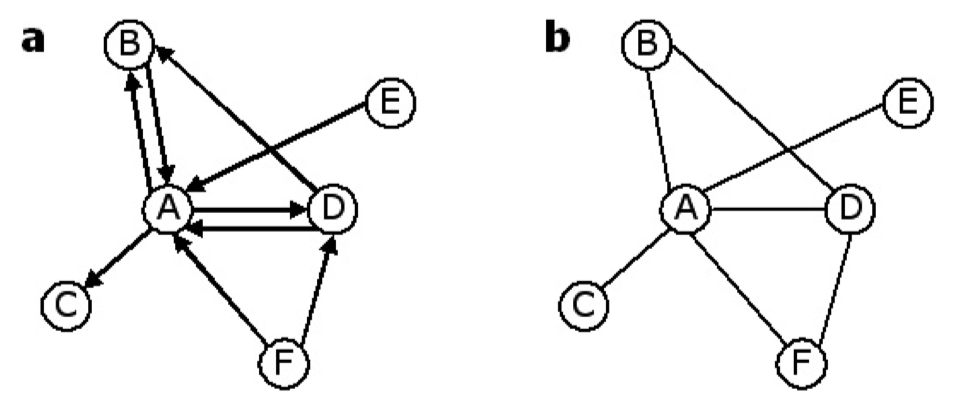
Reciprocity is the degree to which actors in a directed network select one another or the mutuality of the network’s ties
Which of these two networks is directed?
Which ties are reciprocated?
This property is important because it reveals the direction through which resources such as help, advice, and support flow.
It also indicates the network’s stability, as reciprocated ties tend to be more stable over time.
Networks with high reciprocity may be more “equal,” while those with lower reciprocity may be more hierarchical.
In educational contexts, reciprocity has been associated with problem solving, knowledge exchange, risky behavior and drug use.
At the network-level, reciprocity is a measure of the likelihood of vertices in a directed network to be mutually linked.
The {igraph} package has a simple reciprocity() function for calculating network density.
Network Centraliztion
A key structural property of complete networks is the concept of centralization, or the extent to which relations are focused on one or a small set of actors.

A network’s centralization affects the process through which resources flow through the network.
Central actors likely wield a disproportionate amount of influence on the network.
High centralization provides fewer actors with more power and control.
Let’s interpret this output!
$res
  [1]  53   7   6  16  33  33  58  31  14  20 121  24  35  25  31   3  24  19
 [19]  79   3   2  23   6  57  12  34  31   1  35  90   1  15  23  39  34  47
 [37]  11   9  18   1  35  19   8 117   3  11   5   6  42  30  19  17  35  42
 [55]   4  24  11  39  21  65  53  33  36  45   3   8  30  61  10   4  13   6
 [73]   2  16  10   5  11   6   4   7   9   7  14   5   7   1  12  30   1   4
 [91]  18  33   3   7   7  12   5  28   6  29  12   6  14  21   5   6  19   4
[109]  22   4   1   5  10  11  26  35   6   6   7   3  11   3   5   2   1   3
[127]   2  24  14   1   5   6   9   2   2  25  30   9   4   3   5  14   6  21
[145]   2   3  13   8   1   4   2   5   3  10  18   3  11  15   5   3  18   7
[163]  12   1   8   6  14   2   5   9   7   8   9   2   5  14  15   8   6   1
[181]   3  10  12  12  14   2   3   4   3   5   4  18  22   6  12   5   7  36
[199]  14   5  22  13  12   2  17   3  16   7   3   2  10  12   1   2   5   7
[217]  13   5  30   1  10   2  39   2   1  15   2   2   1   3   7   3   1  37
[235]   4   3   1   2   3   2   3   4   8   1   3   6   8   9  12   4   5   3
[253]   3   2   2   5   4   5   3   1   2   4   1   2   4   5   2   9   3   2
[271]   4   2   4   1   5   5   6   5  12   3   8   1   1   2   6   2   4   2
[289]   3   1   1   2   3   1   5   1   2   3   2  15  14   5   7   2   2   4
[307]   6   8   1  30   1   1   1   2   2   1   6   4   4   3   2   5   3   4
[325]   2   3   1   1   9   3   6   1   2   2   6  12   4   4   2   3  11   4
[343]   2   2   3   3   5   1   1   6   6   1   2   3   4   5   2   2   1   4
[361]  21   1   1   1   1   2   1   1   1   1   1   1   1   1   1   3   2   2
[379]   2   1   1   2   1   1   1   1   1   2   1   1   1   1   1   1   1   1
[397]   3   1   2   1   1   1   2   1   1   3   1   1   2   3   1   1   2   1
[415]   2   1   1   1   1   1   1   4   1   1   1   1   1   1   1   1   1  43
[433]   2   3   1   1   2   2   2   1   0   0   0 581 332

$centralization
[1] 0.6429242

$theoretical_max
[1] 394272What’s Next?
SNA Case Study: A Tale of Two MOOCs
Guiding Study: A Social Network Perspective on PEER Supported Learning in MOOC-Eds (Kellogg, Booth, and Oliver 2014)
Acknowledgements

This work was supported by the National Science Foundation grants DRL-2025090 and DRL-2321128 (ECR:BCSER). Any opinions, findings, and conclusions expressed in this material are those of the authors and do not necessarily reflect the views of the National Science Foundation.
