Your First LASER Badge!
Orientation Module: Badge

The final activity for each learning module provides space for you to reflect on how the concepts and techniques introduced in each module might apply to their own research and to create a simple “data product” to share the results of an analysis with a wider audience. Krumm et al. Krumm, Means, and Bienkowski (2018) have outlined the following 3-step process for communicating with education stakeholders findings from an analysis:
Select. Communicating what one has learned involves selecting among those analyses that are most important and most useful to an intended audience, as well as selecting a form for displaying that information, such as a graph or table in static or interactive form, i.e. a “data product.”
Polish. After creating initial versions of data products, research teams often spend time refining or polishing them, by adding or editing titles, labels, and notations and by working with colors and shapes to highlight key points.
Narrate. Writing a narrative to accompany the data products involves, at a minimum, pairing a data product with its related research question, describing how best to interpret the data product, and explaining the ways in which the data product helps answer the research question and might be used to inform new analyses or a “change idea” for improving student learning.
Data Products
In later modules, you will have an opportunity to create a “data product” designed to illustrate some insights gained from your analysis and ideally highlight an action step or change idea that can be used to improve learning or the contexts in which learning occurs.
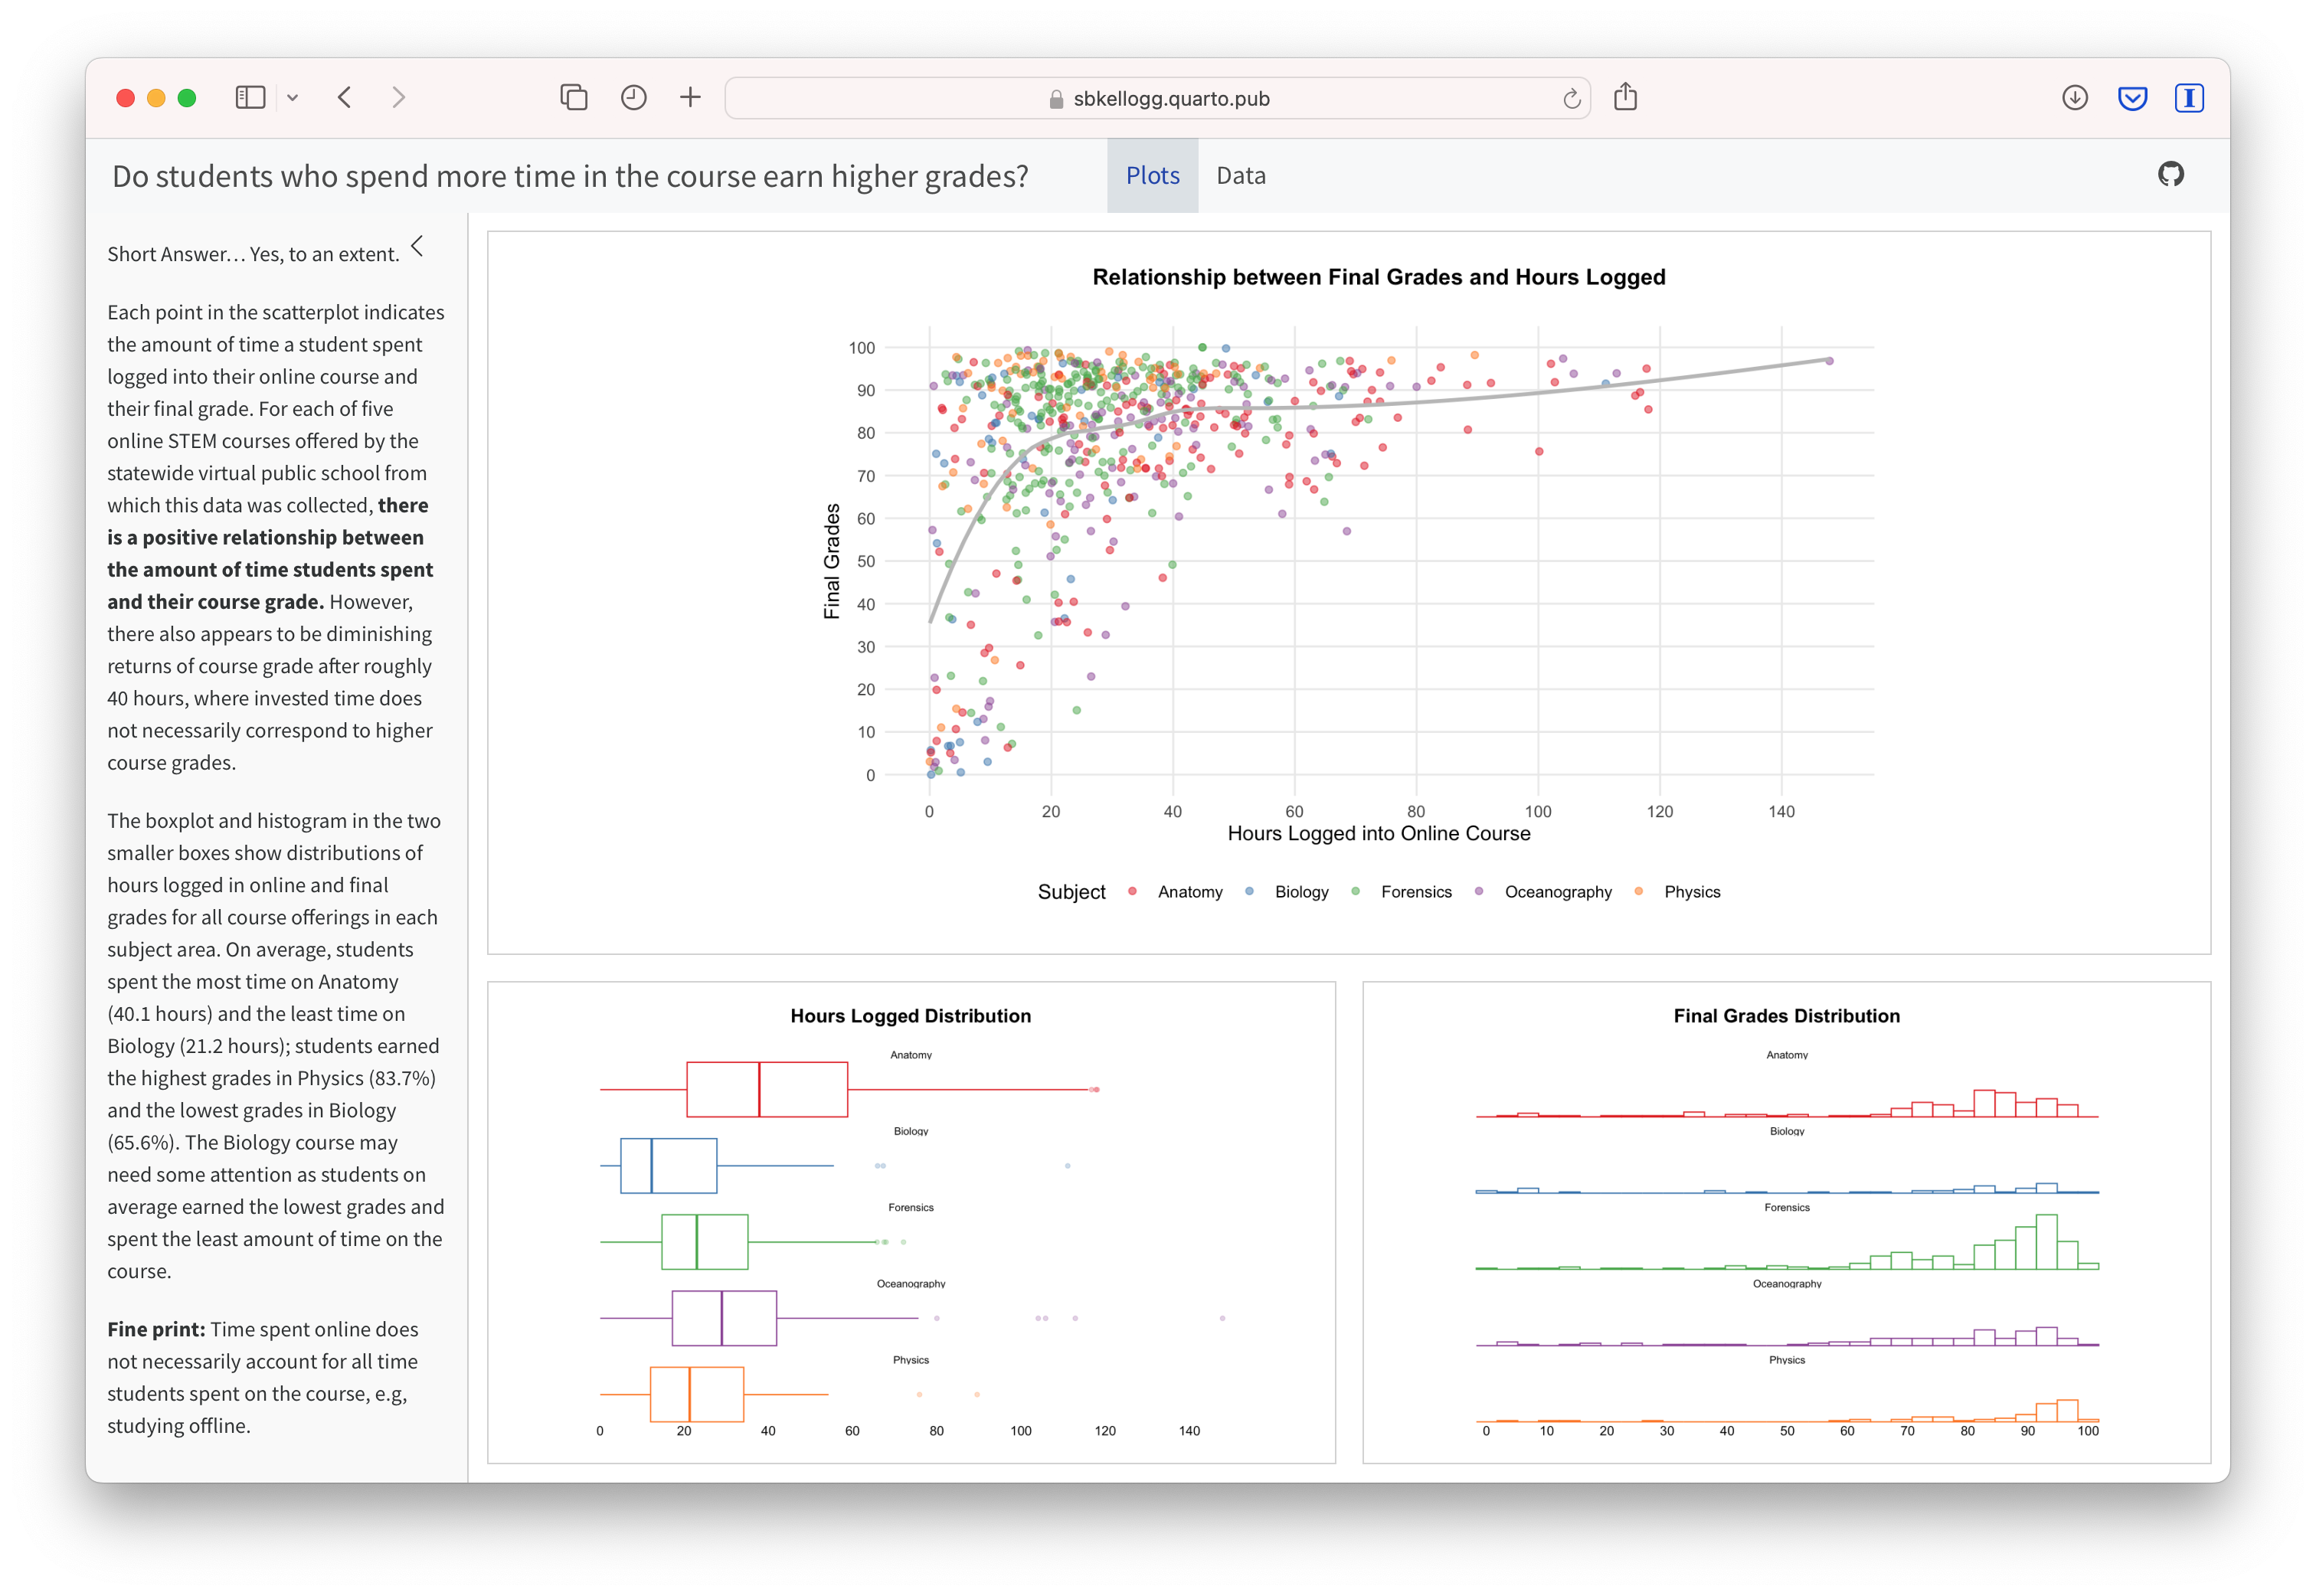
For example, imagine that as part of a grant to improve student performance in online courses, your are working with the instructors who taught for a virtual public school. As part of some early exploratory work to identify factors influencing student performance, you are interested in sharing some of your findings about hours logged in the LMS and their final grades. One way we might communicate these findings is through a simple data dashboard like the one shown below. Dashboards are a very common reporting tool and their use, for better or worse, has become ubiquitous in the field of Learning Analytics.
Your First LASER Badge
To earn your first badge for the LASER Orientation Module, you will simply need to Render and Publish your LASER Orientation Case Study file by converting your Quarto doc to an HTML file and sharing online via one of several publishing services.
Render Document
Rendering a document does two important things, namely when you render a document it:
checks through all your code for any errors; and,
creates a file in your project directory that you can use to share you work.
Render Quarto documents can be done by clicking the  Render button in the toolbar at that the top of a
 .qmd file. Rendering will covert a your case study document to a HTML web page as specified in the case study’s YAML header. Web pages are just one of the many publishing formats you can create with Quarto documents.
Publish File
There are a wide variety of ways to publish documents, presentations, and websites created using Quarto. Since content rendered with Quarto uses standard formats (HTML, PDFs, MS Word, etc.) it can be published anywhere. Additionally, there is a quarto publish command available for easy publishing to various popular services such as Quarto Pub, Posit Cloud, RPubs , GitHub Pages, or other services. Step by step directions are provided in the LASER Orientation Case Study.
