Learning Analytics Workflow is designed for those seeking an introductory understanding of learning analytics using basic R programming skills, particularly in the context of STEM education research.
It consists of consists of four modules. Each module of LAW includes:
Essential readings
Conceptual overview slidedeck
Code a-long slidedeck
Case study activity that correlates with the Learning Analytics workflow
Optional badge activity
Module Objectives
By the end of this module:
Fundamentals of Data Visualization:
Learners will grasp the basic concepts and significance of data visualization in distilling complex educational data into comprehensible and actionable insights.
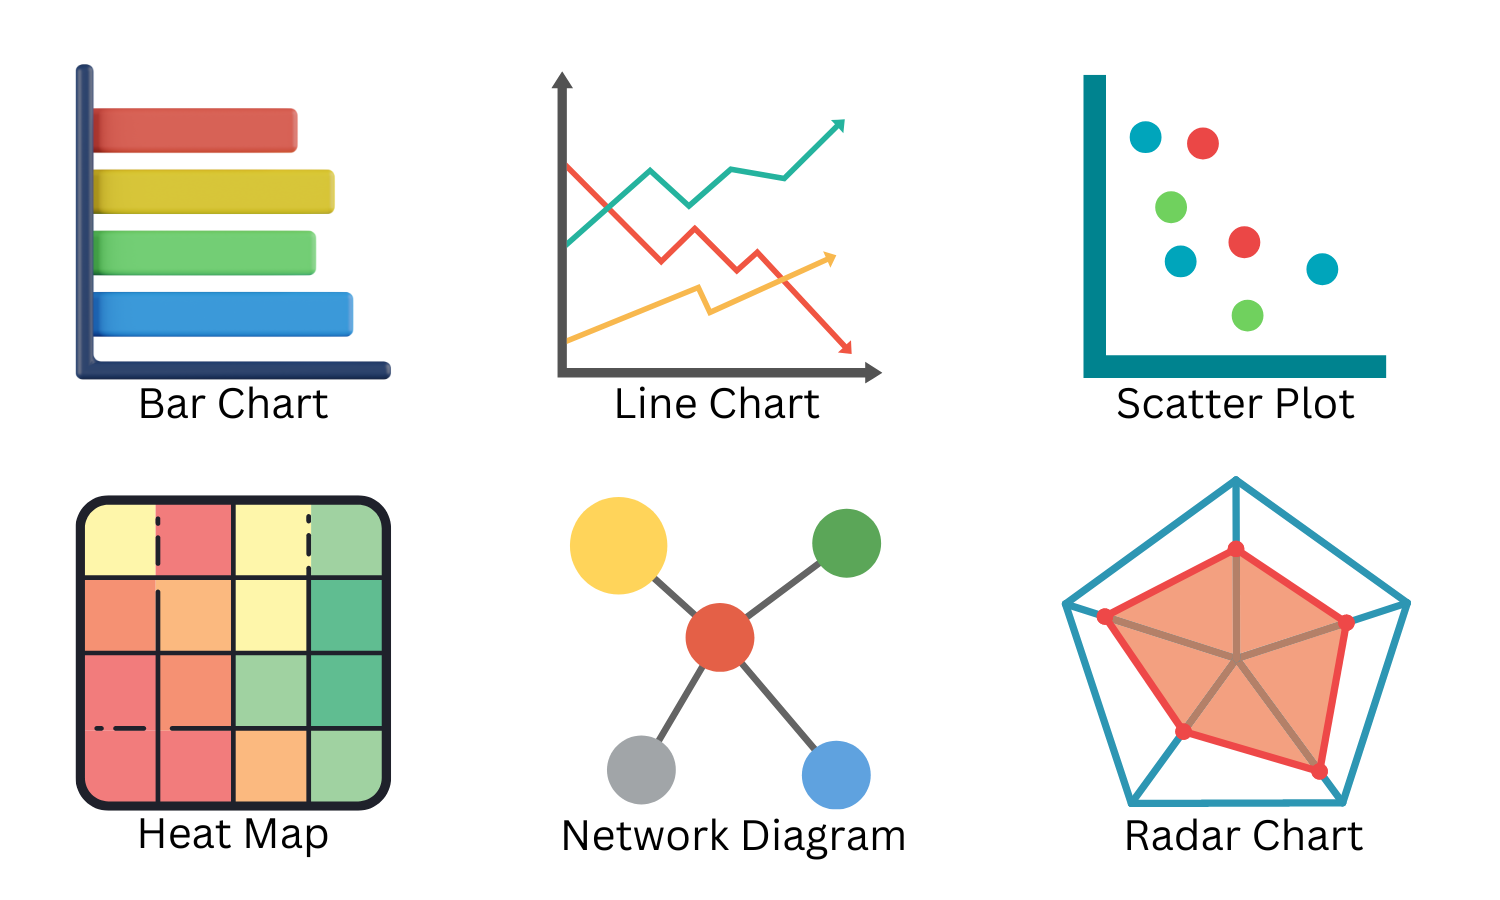
Variety of Visualization Techniques:
Participants will be able to identify and apply different types of visualizations, such as charts, graphs, and heatmaps, to represent educational data effectively.
Practical Application and Best Practices:
Learners will gain insights into real-world applications of data visualization in education and learn best practices to enhance the clarity and impact of their visual data presentations.